Overview
In Kaltura, if you are the media owner or co-editor, you can see who has watched a video and for how long. This can be a helpful way to see whether and how often users are viewing videos you have posted, and/or finding out when they (or specific users) have lost interest/stopped watching the video.
Instructions
Viewing analytics for Kaltura videos is only possible when it has been published in the following ways:
- By adding Kaltura video to a course, either using Embed Kaltura Media button in the Rich Content Editor or by adding the video to a Media Gallery.
Viewing Kaltura's Analytics for a Video
- From My Media or Media Gallery click the title of a media resource. The media's detail page appears.
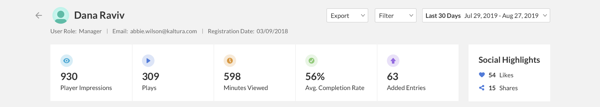
- From the Actions dropdown, pick Analytics. The Analytics page appears. A summary of data analytics appears at the top, with each section broken down into greater detail below the video.
- Note: If you cannot find the Analytics menu option, try making your browser window wider and try again (CTRL + to Zoom in and CTRL - to Zoom out).
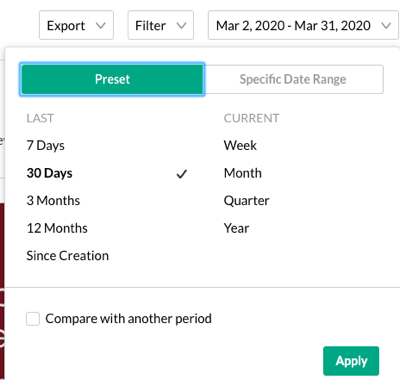
- To change the period you are reviewing, select the Date Range in the upper right
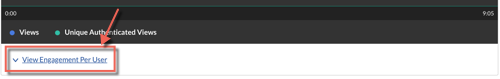
- For details about specific viewers, select View Engagement Per User below the video. The user analytics detail page appears.
Analytics Features:
Video Performance Over Time
By default, the Player Impression tab shows, displaying a graph of impressions. Impressions data shows how many times your video thumbnails are shown. Think of each impression as your potential reach and an opportunity to earn a view. An impression counts every time a video thumbnail is shown to someone.
To explore engagement trends over time, use the graph to review key metrics:
- Number of plays: Number of times users clicked play to watch a video
- Number of unique viewers: Number of authenticated viewers; all anonymous viewers will be counted as a single viewer
- Number of minutes viewed: Total duration of video watched by viewers
- Average drop off rate: Measured by viewer reaching playback milestones
- Avg. Drop-off reports display the following data for play-through by viewers of your content:
- 25% play-through: The number of plays that reached 25% of the video
- 50% play-through: The number of plays that reached 50% of the video
- 75% play-through: The number of plays that reached 75% of the video
- 100% play-through: The number of plays that reached 100% of the video
- Play-through Ratio: The percentage of completed plays. The number of 100% of play-throughs is divided by the total number of plays.
How player impressions lead to engagement
Engagement refers to comments, likes, or any other measurable interaction with your media.
![player engagements. number of player impressions, number of plays, impressions that resulted in [percent dropdown] play-through with accompanying inverted funnel of completion percent.](http://it-knowledge.umn.edu/sites/it-knowledge.umn.edu/files/tdxassets/kaltura-engagement-funnel.png)
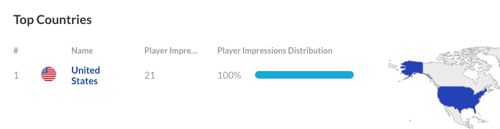
Top Countries
This section tracks countries with the most engagement with your media, as well as impression information.
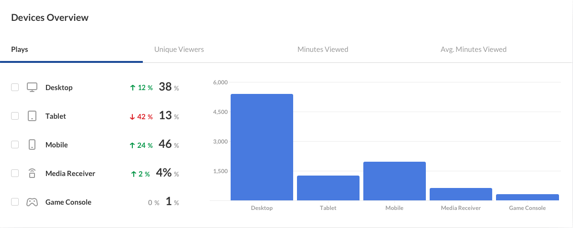
Devices Overview
This section shows which types of devices are used to access your media.
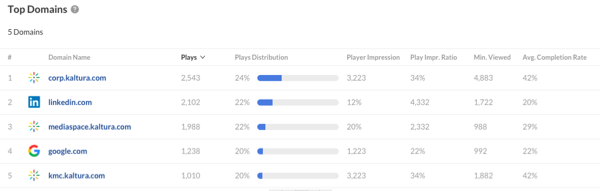
Top Domains
The top domains are ordered by sites that had the most number of plays in the selected time frame. For each domain the following metrics are available:
- Plays
- Plays distribution: number of plays divided by the total number of plays in the selected timeframe
- Player impressions
- Player impressions ratio: number of plays divided by the number of impressions
- Minutes viewed
- Average drop-off rate: measured by viewer reaching playback quartiles/milestones
Questions? Need Help?
If you have questions or need some help, please let ITS know by submitting a Raven Solutions request.